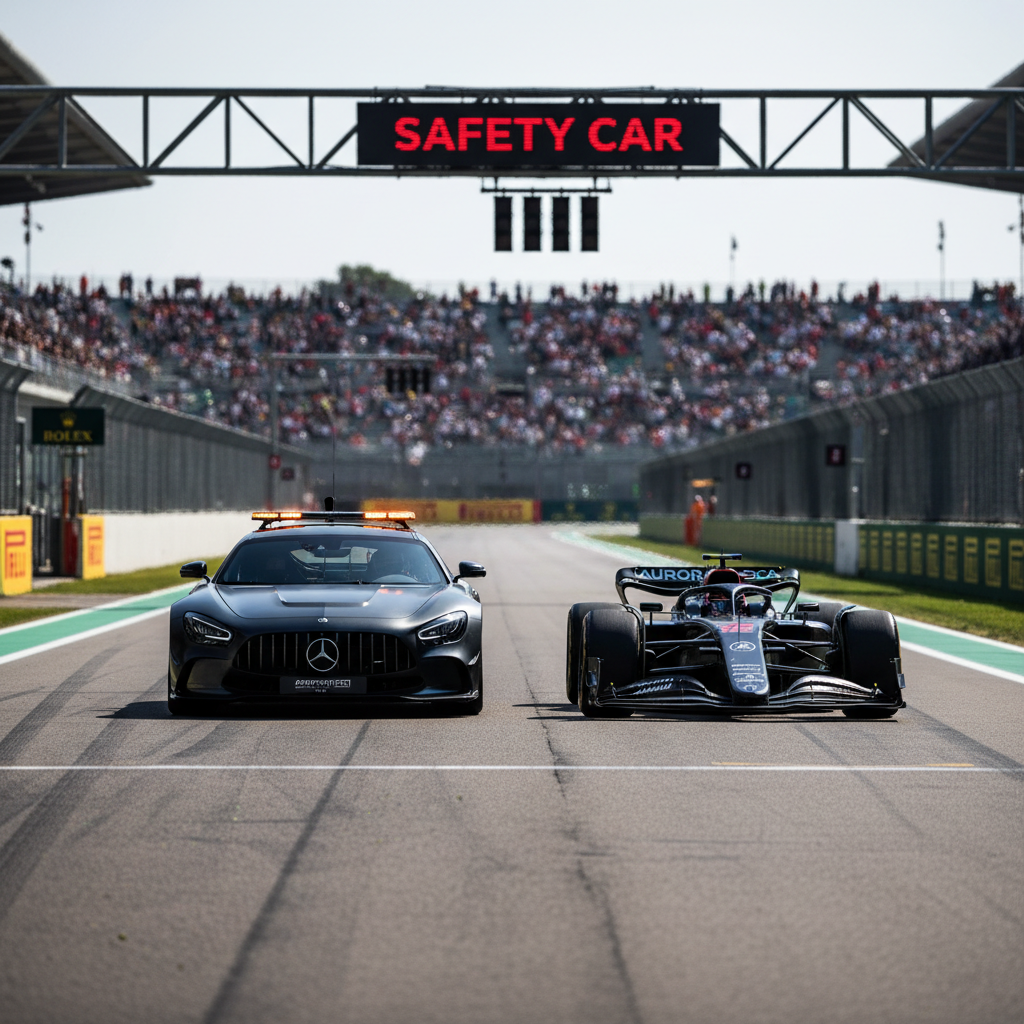
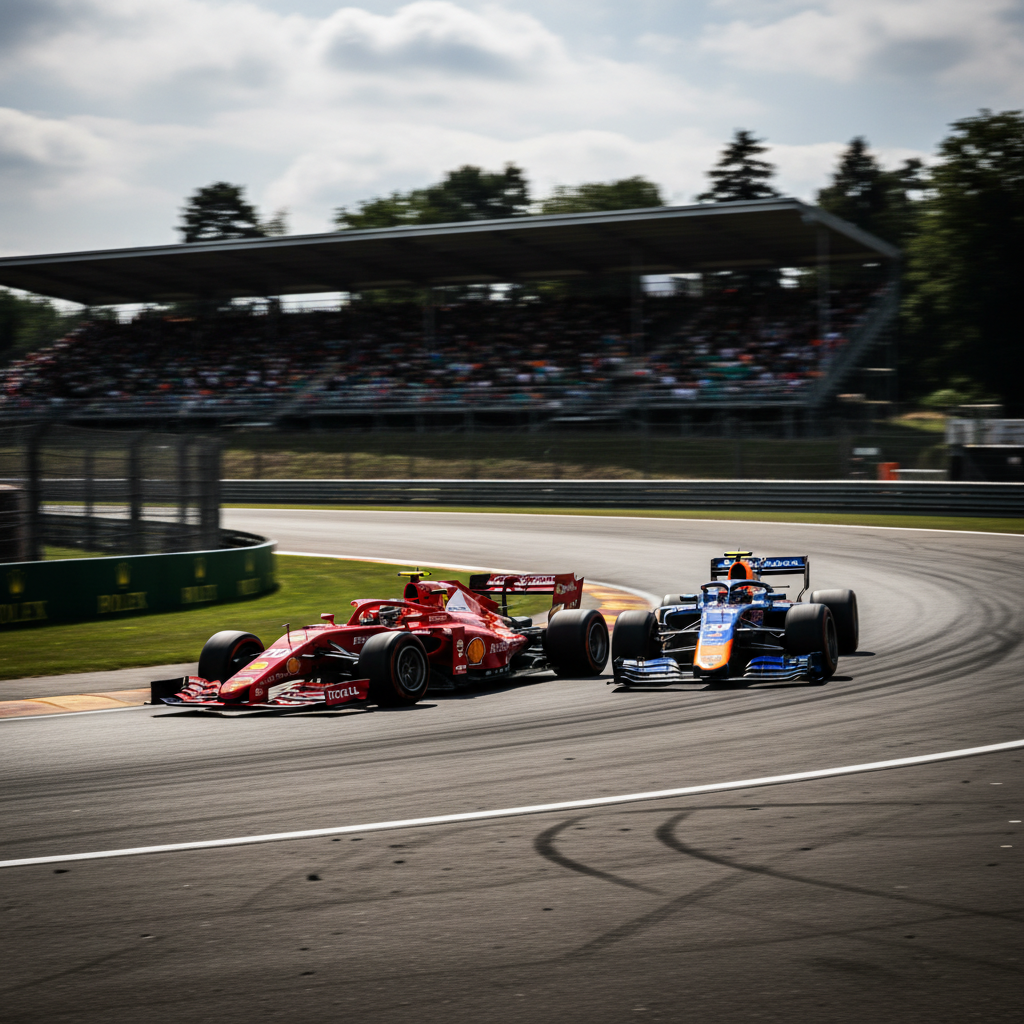
Why Monza's Safety Car Changed Everything — And Why It Shouldn't Have
The virtual safety car window closed 0.3 seconds before Rossi could pit. That 0.3 seconds cost him the championship.
Every race is a thousand decisions compressed into two hours.
We dissect every one.
Every race weekend is a compressed laboratory — engineers running thousands of simulations before a wheel turns, drivers reading tire degradation through their fingertips at 280 km/h, strategists weighing probability trees in real-time while the broadcast team is still describing what happened three corners ago.
Apex exists for the people who already knew the undercut was coming. For the sim racer who pauses onboard footage at the braking zone. For the karter who reads timing screens between sessions and sees what others miss.
We don't summarize races. We dissect them — corner by corner, compound by compound, decision by decision. The kind of analysis that takes longer to write than the race took to run.

"The data doesn't lie. It just requires someone willing to read it at 3 a.m."
— Apex Editorial


When Marcus Veltri pitted on lap 31, the timing screens showed a 2.4-second gap to the car ahead. Conventional wisdom said undercut. The data said something different.
Sector 2 degradation on the medium compound was running 0.08 seconds per lap faster than the pre-race model predicted. Veltri's race engineer had been watching this number for six laps. The overcut — staying out while competitors pitted — would require clean air and a 1:29.1 average for four consecutive laps. Possible, but not comfortable.
What the broadcast missed was the strategic logic that made this inevitable from lap 26 onward. The probability tree had collapsed to a single branch. Here is how to read it.
"The probability tree had collapsed to a single branch. Most analysts never saw the pivot point."
— From this analysisWeekly post-race analysis. Every compound choice, every strategy call, every overtake — dissected.
No spam. Unsubscribe after any race weekend.

Every race Sunday produces a post. Not a recap — a dissection. Lap-by-lap strategy charts, compound degradation curves, and the decision that swung the result.
Aerodynamic concepts, suspension geometry, power unit architecture — explained with the rigor of an engineer's whiteboard session, not a press release.
We rebuild race strategy from scratch — what if the safety car came one lap earlier? What if they stayed out? Monte Carlo probability trees, rebuilt in prose.
"Every race is a thousand decisions compressed into two hours."
No paywall. No account. Three complete analyses, free. If the craft earns your inbox, you'll know.

The virtual safety car window closed 0.3 seconds before Rossi could pit. That 0.3 seconds cost him the championship.

A 0.4% reduction in downforce through 130R means 2.8 seconds lost across a stint. Here is the aerodynamic math.

Raidillon overtakes succeed 34% of the time when the gap at the bottom is between 0.6 and 0.9 seconds. Here's why.
148 analyses in the archive. Every race since 2024.
Updated within 48 hours of each chequered flag